Six months into most AI rollouts, nobody can tell the CFO what it costs per outcome or what it replaced — finance wants chargeback, the board wants proof, and the vendor's dashboard shows API calls. Here every run is metered natively — tokens and dollars per message, per call, per worker — and rolls up into scorecards you can defend a budget with: cost per successful run, spend against a hard cap, exportable by group.
In a pack, the ledger arrives wired: runs, cost, and outcomes tracked from the first install.
See Solution Packs →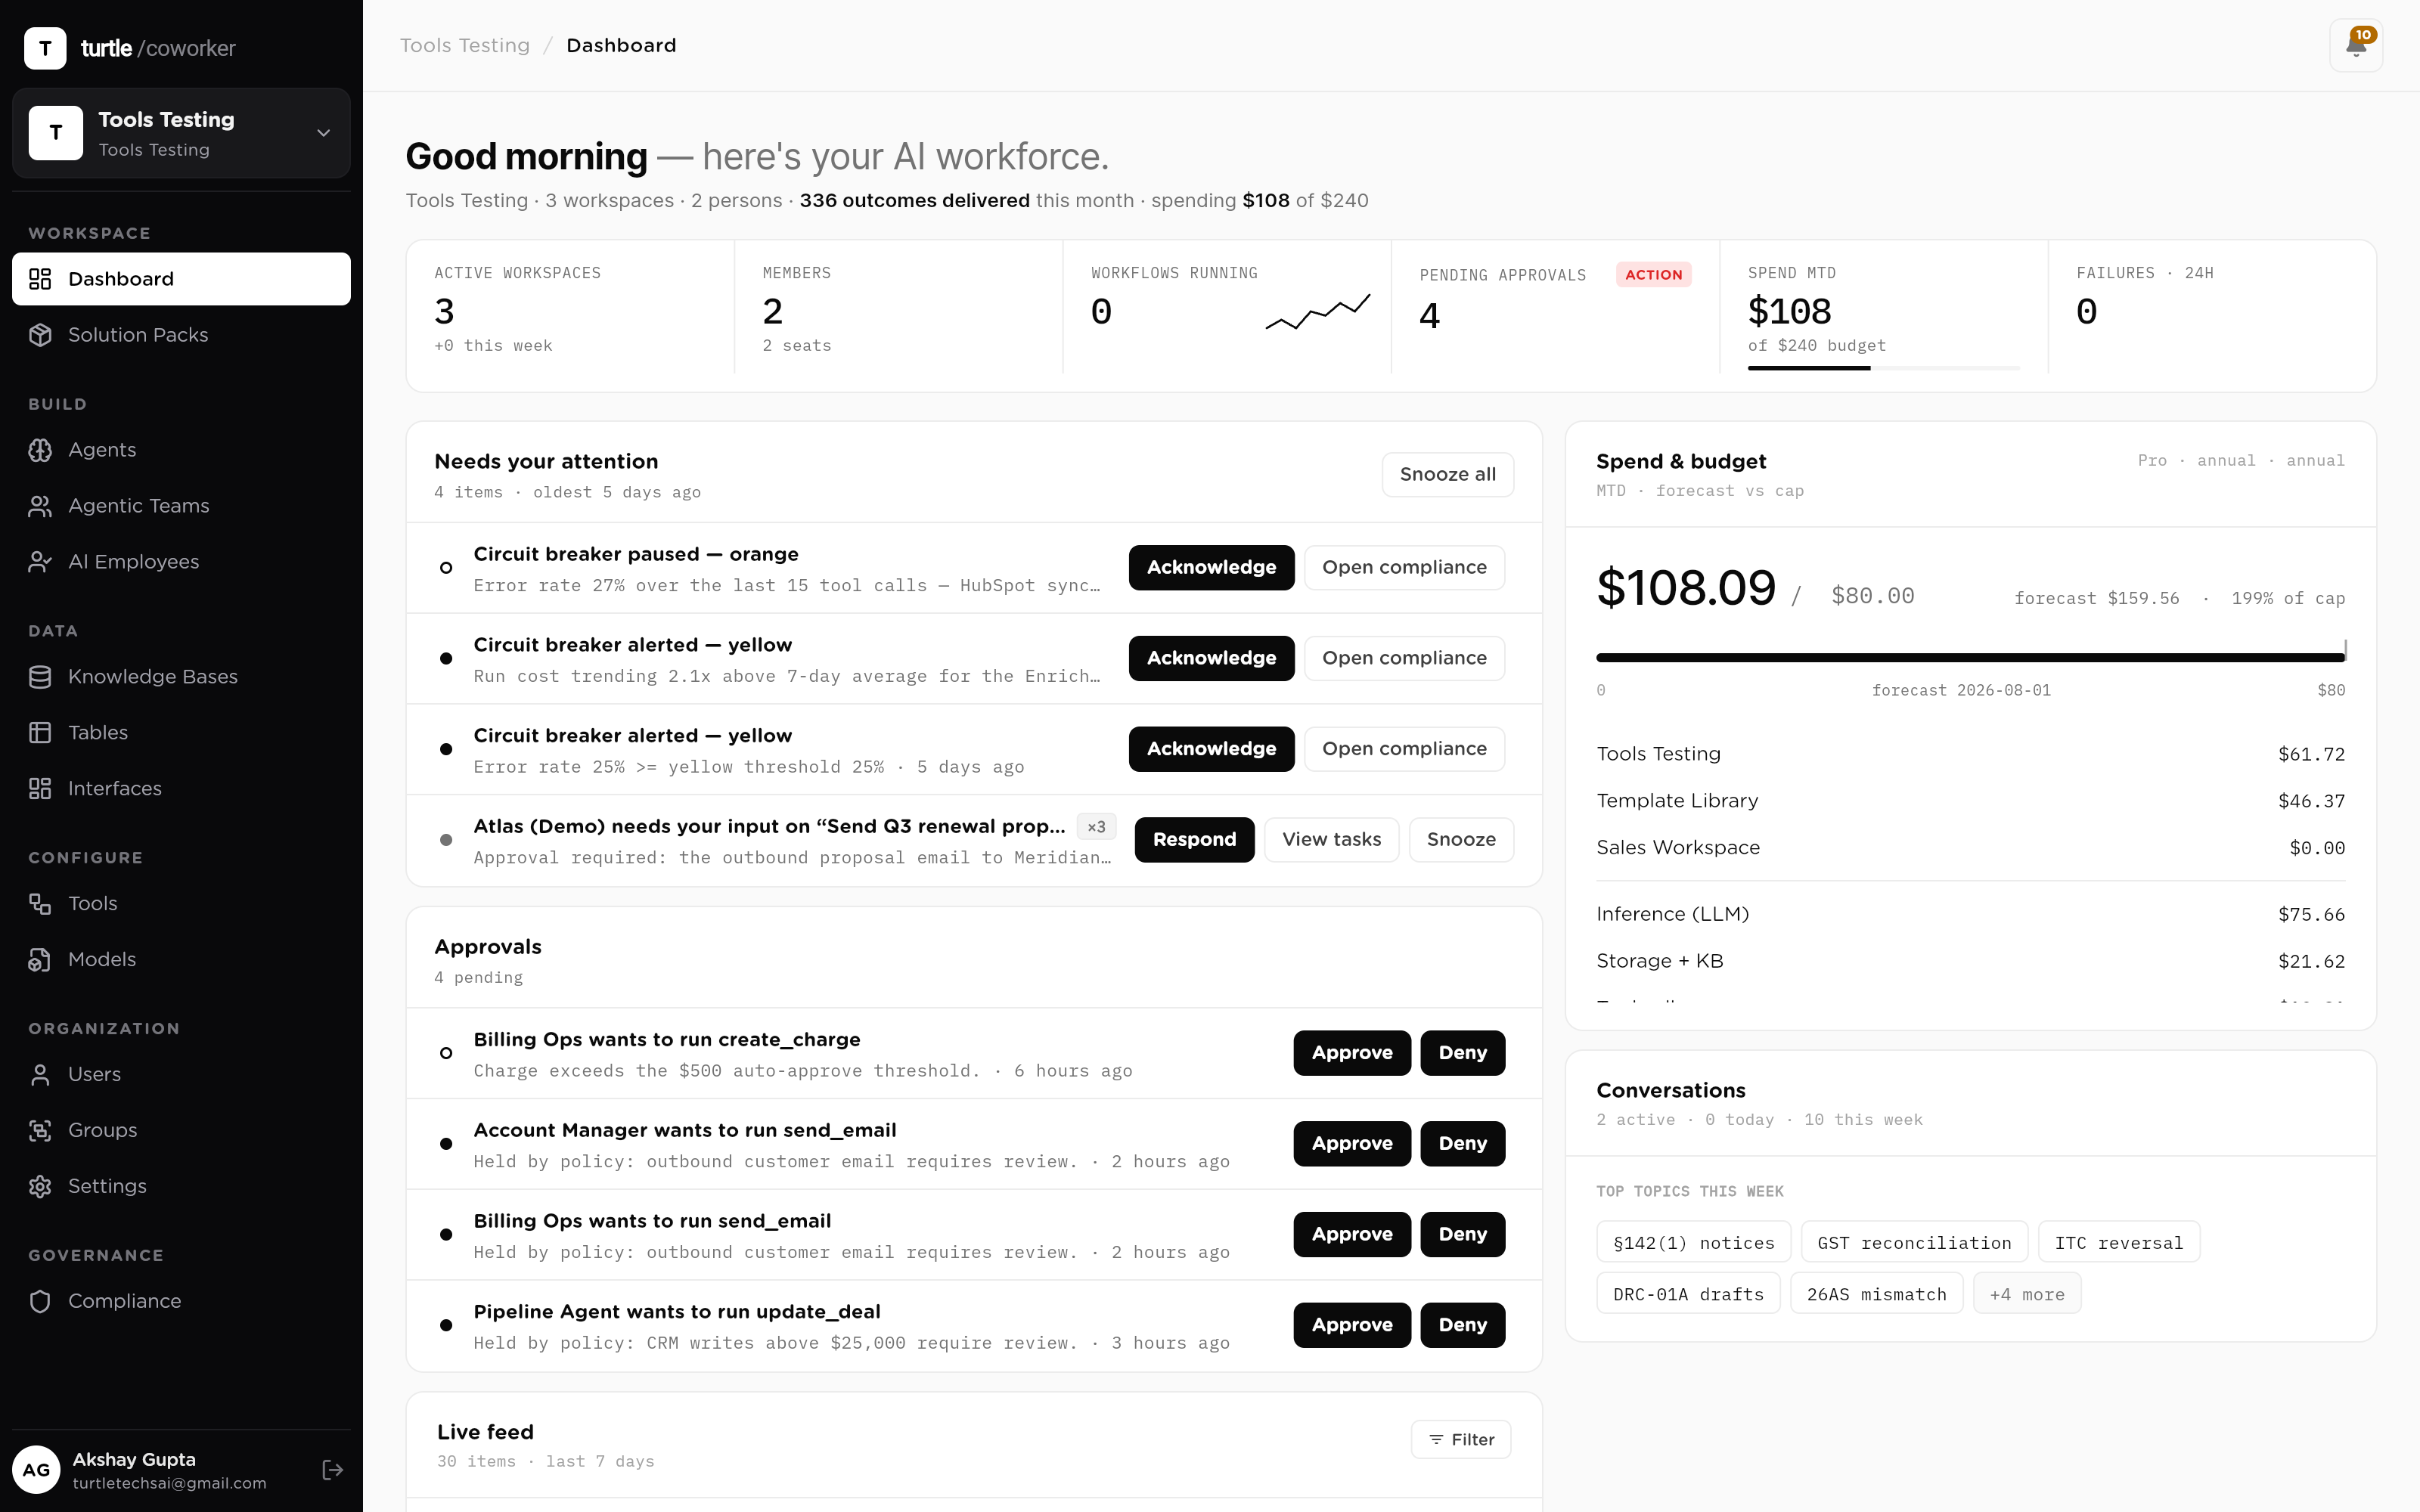
AI spend without outcome accounting dies in the next budget cycle — not because it didn't work, but because nobody could prove it did. The pilot's champion is left arguing anecdotes against an invoice.
So the accounting is native, not bolted on. Every model call records its tokens and dollars per message on the way through; every run totals cost and duration; every tool call lands in the audit trail. Analytics is a read of that ledger — attributable down to the worker, the run and the message, and exportable in the shape finance asks for.
From the metering underneath to the export finance takes away: every layer between a token and a defensible number.
Roll-up numbers are only as good as what's underneath, and most AI reporting is built on estimates. Here the accounting is native: every model call records its tokens and its dollars per message, every run totals tokens, cost and duration, and every tool call is classified and logged in the audit trail. The quarterly number is a sum of real rows, not a model of a model — which is why finance can lean on it.
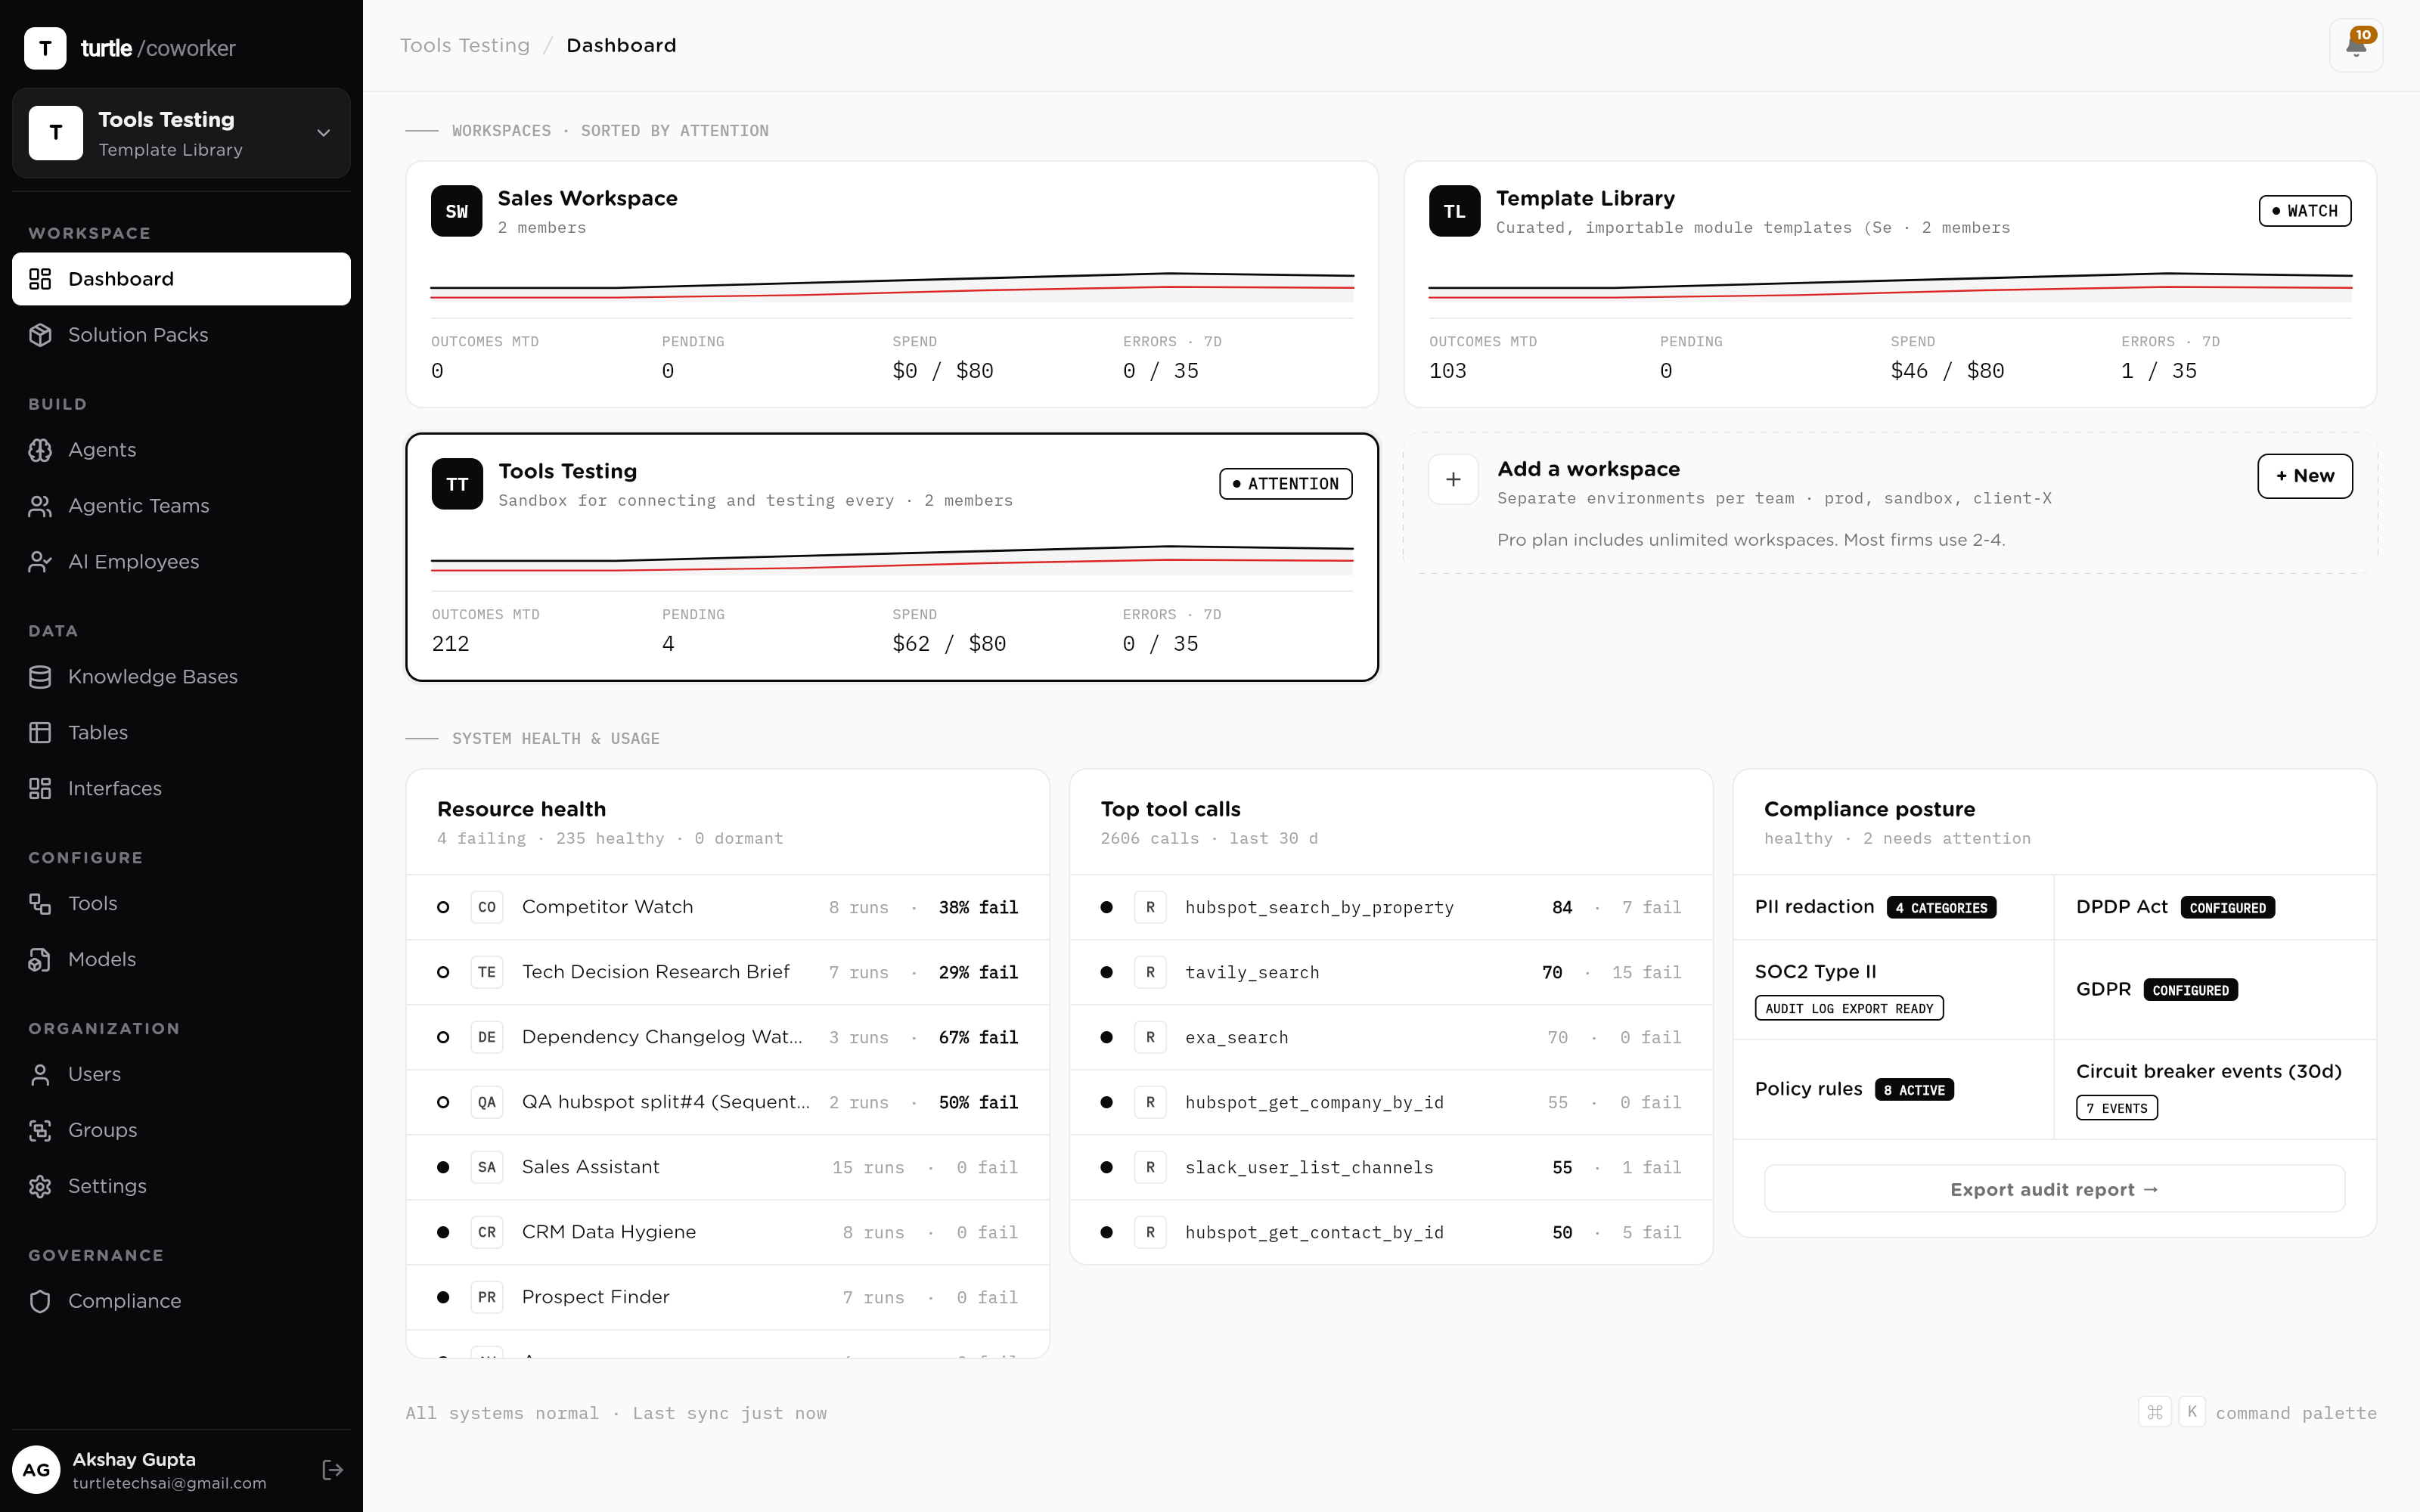
Six months in, 'how is the AI going?' is usually answered with anecdotes. The org overview answers it in one scroll: five health KPIs with prior-period deltas, a spend trend, an activity heatmap, and a live attention feed of failures, tripped breakers, budget warnings and flagged PII. Whether spend is drifting, runs are failing or adoption is stalling is visible before anyone opens a ticket.
The month the bill jumps, the vendor's answer is 'usage went up.' Here the spend trend sits beside a Top-by-spend leaderboard that ranks your most expensive workers. When the trend ticks up week-over-week, the worker driving it is one glance away — a specific agent, team or employee you can open, inspect and fix.
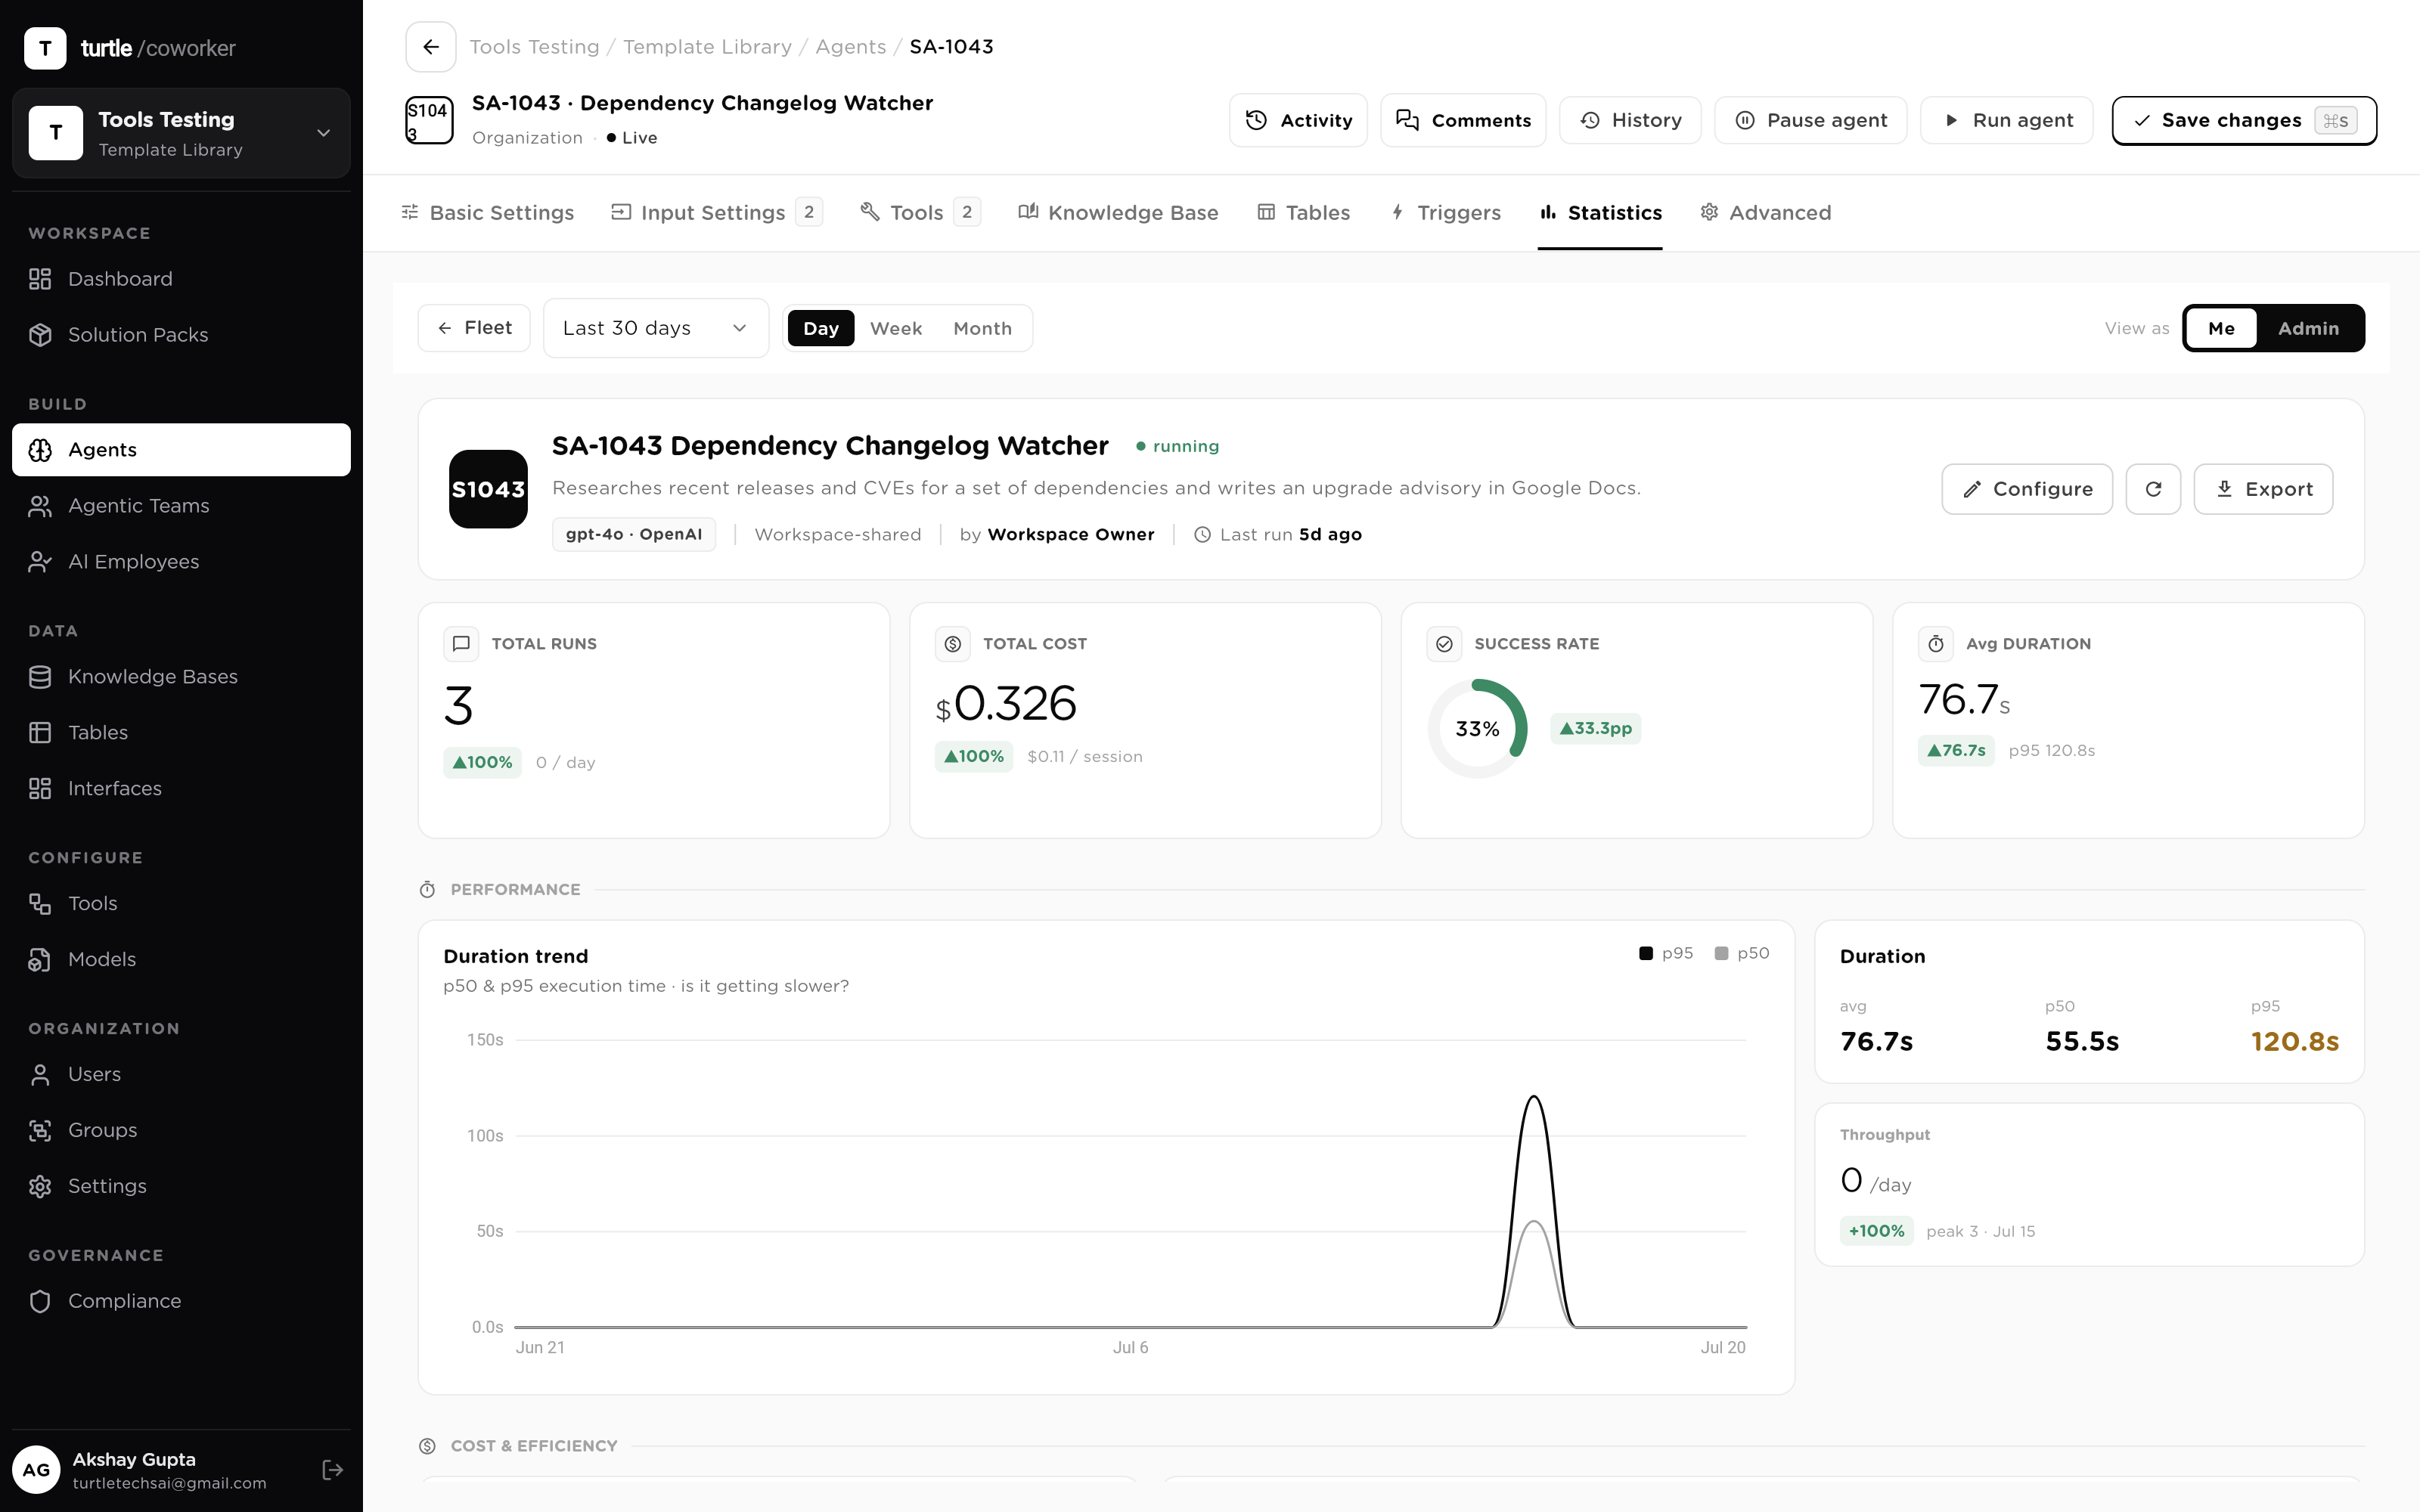
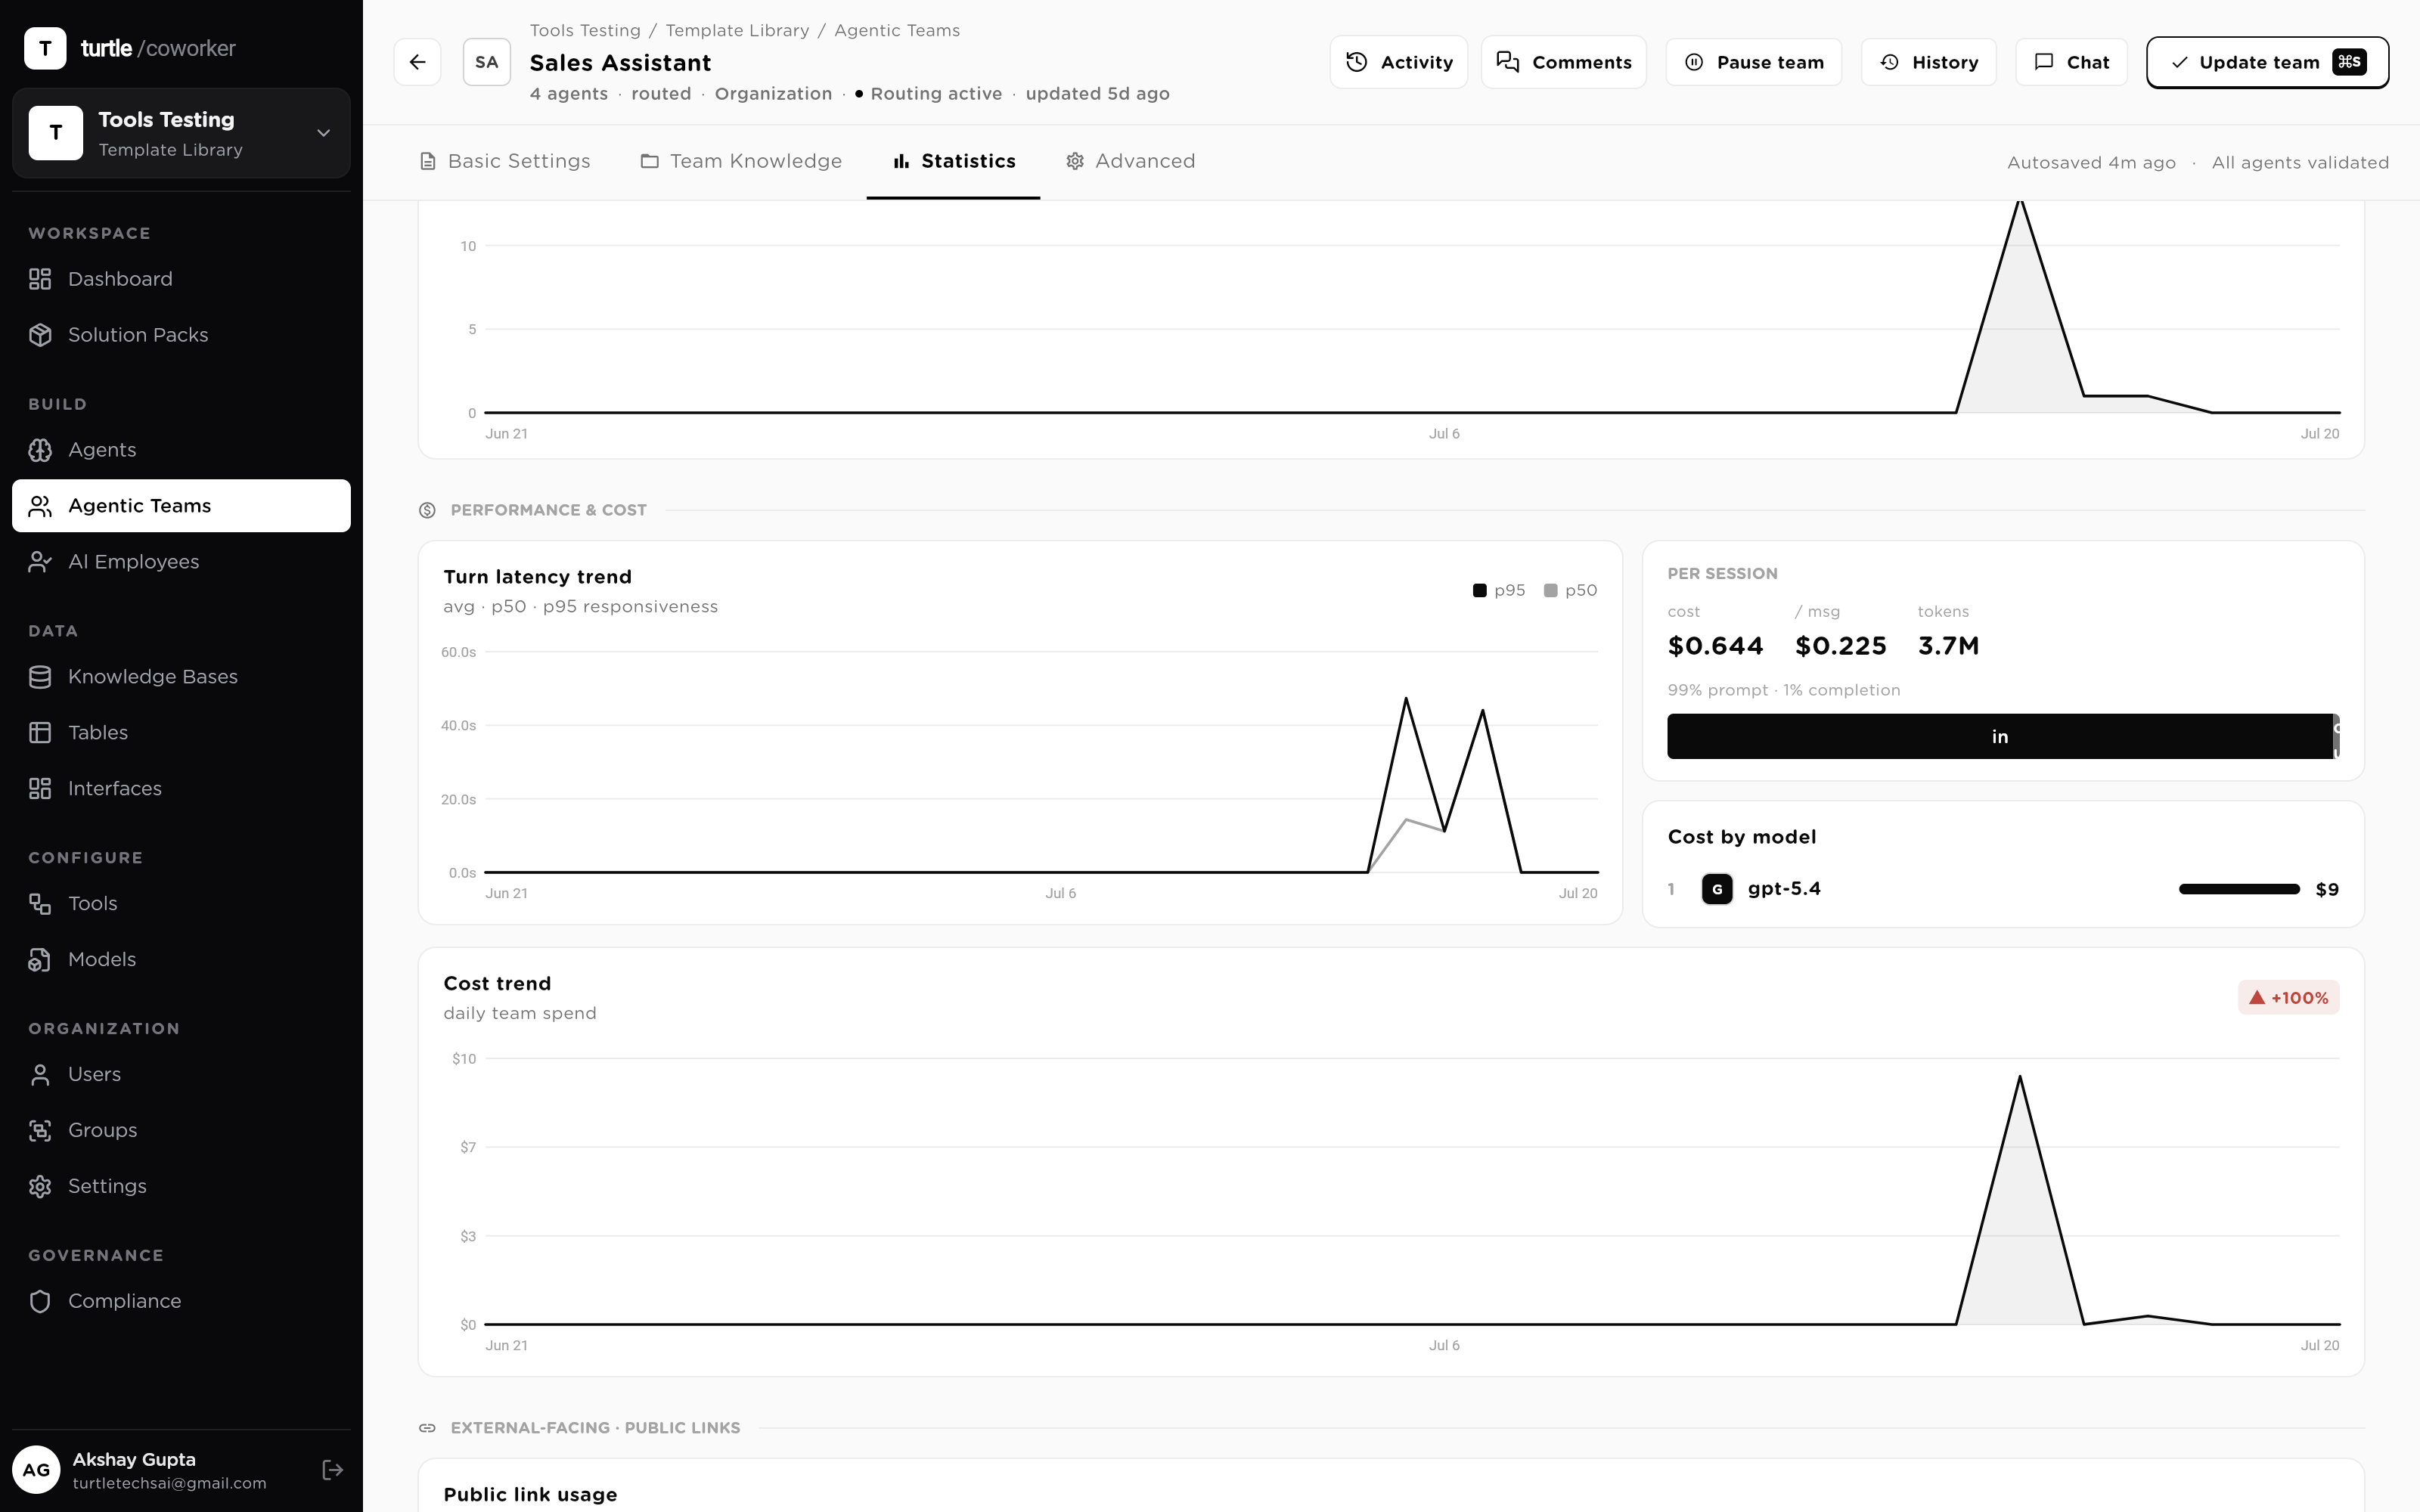
Cost per API call flatters everyone. A single worker's scorecard counts cost per successful run — total spend divided by the runs that actually finished the job — alongside a failure-reason breakdown, a p50/p95 duration trend and a trigger-source split. That distinction is where a prompt change that quietly doubled retries finally shows up: cost per attempt barely moves, cost per success jumps.
Averages hide the worker that's quietly burning the budget. Entity Analytics ships one Statistics screen per type — Agents, Teams, AI Employees, Models, Users, Groups — each ranking its instances against each other. The Agents screen alone carries four leaderboards: most run, most expensive, highest failure rate, slowest. The interesting worker is the one whose rank differs across them: mid-pack on runs, first on failures.
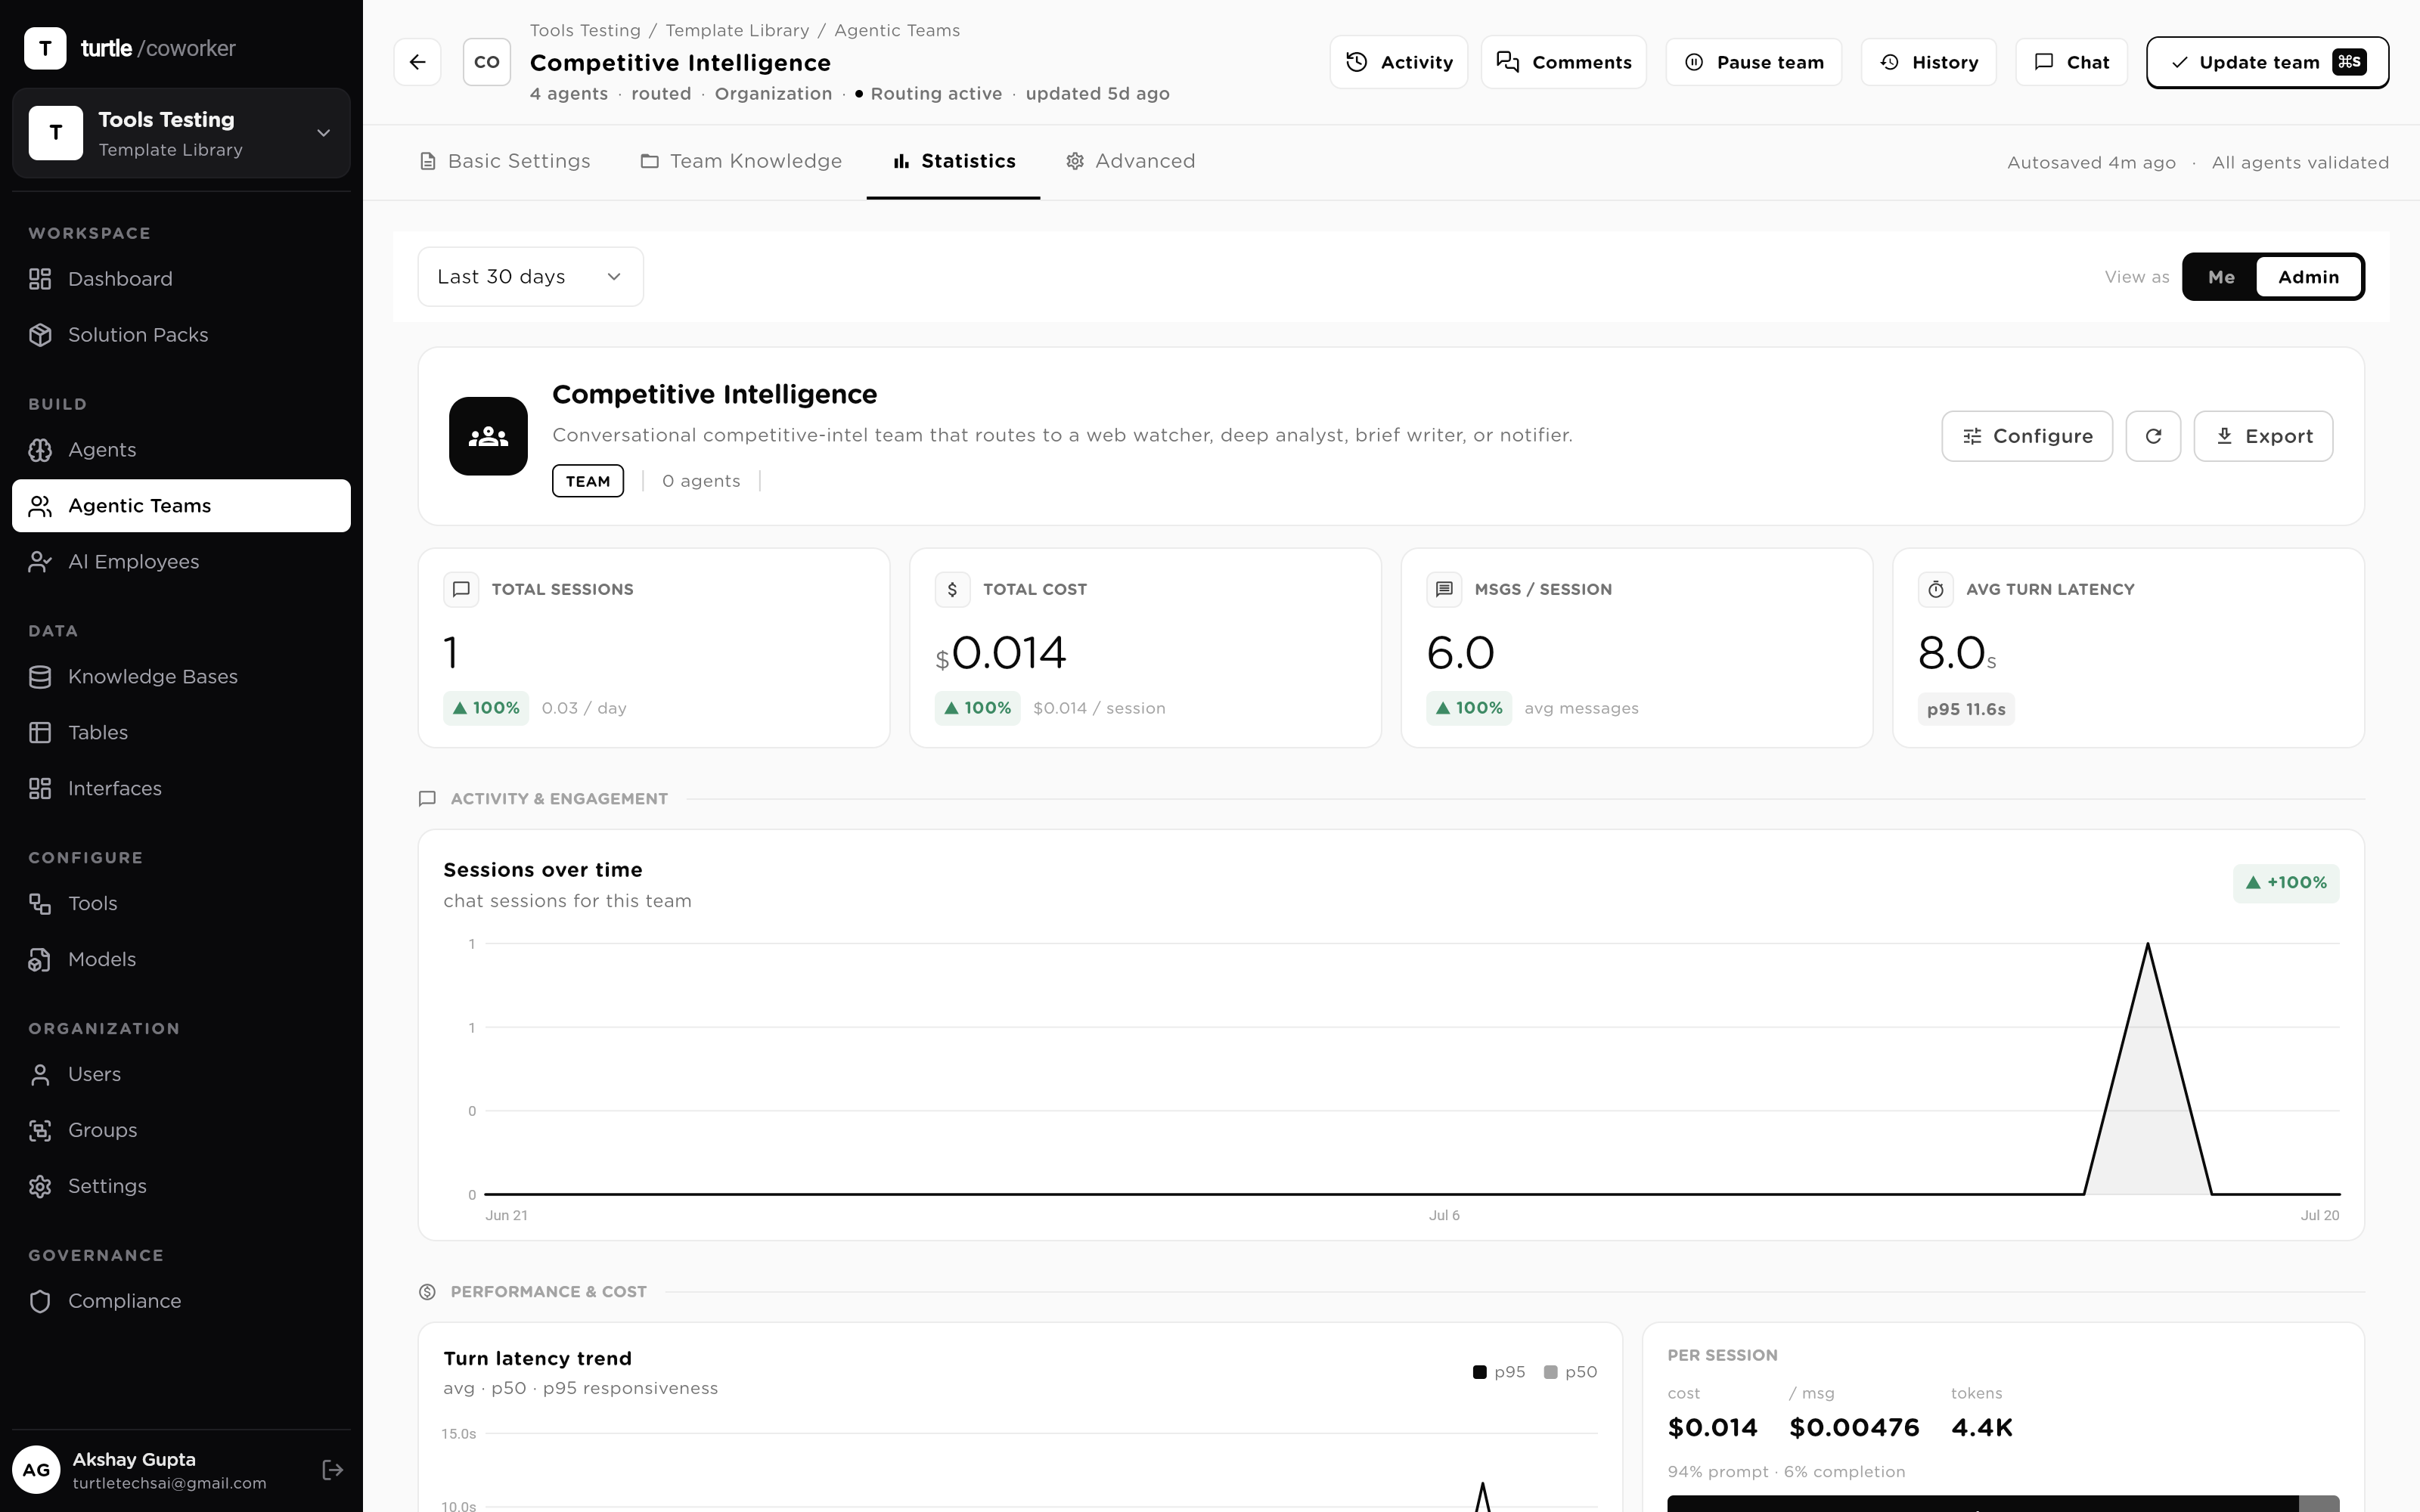
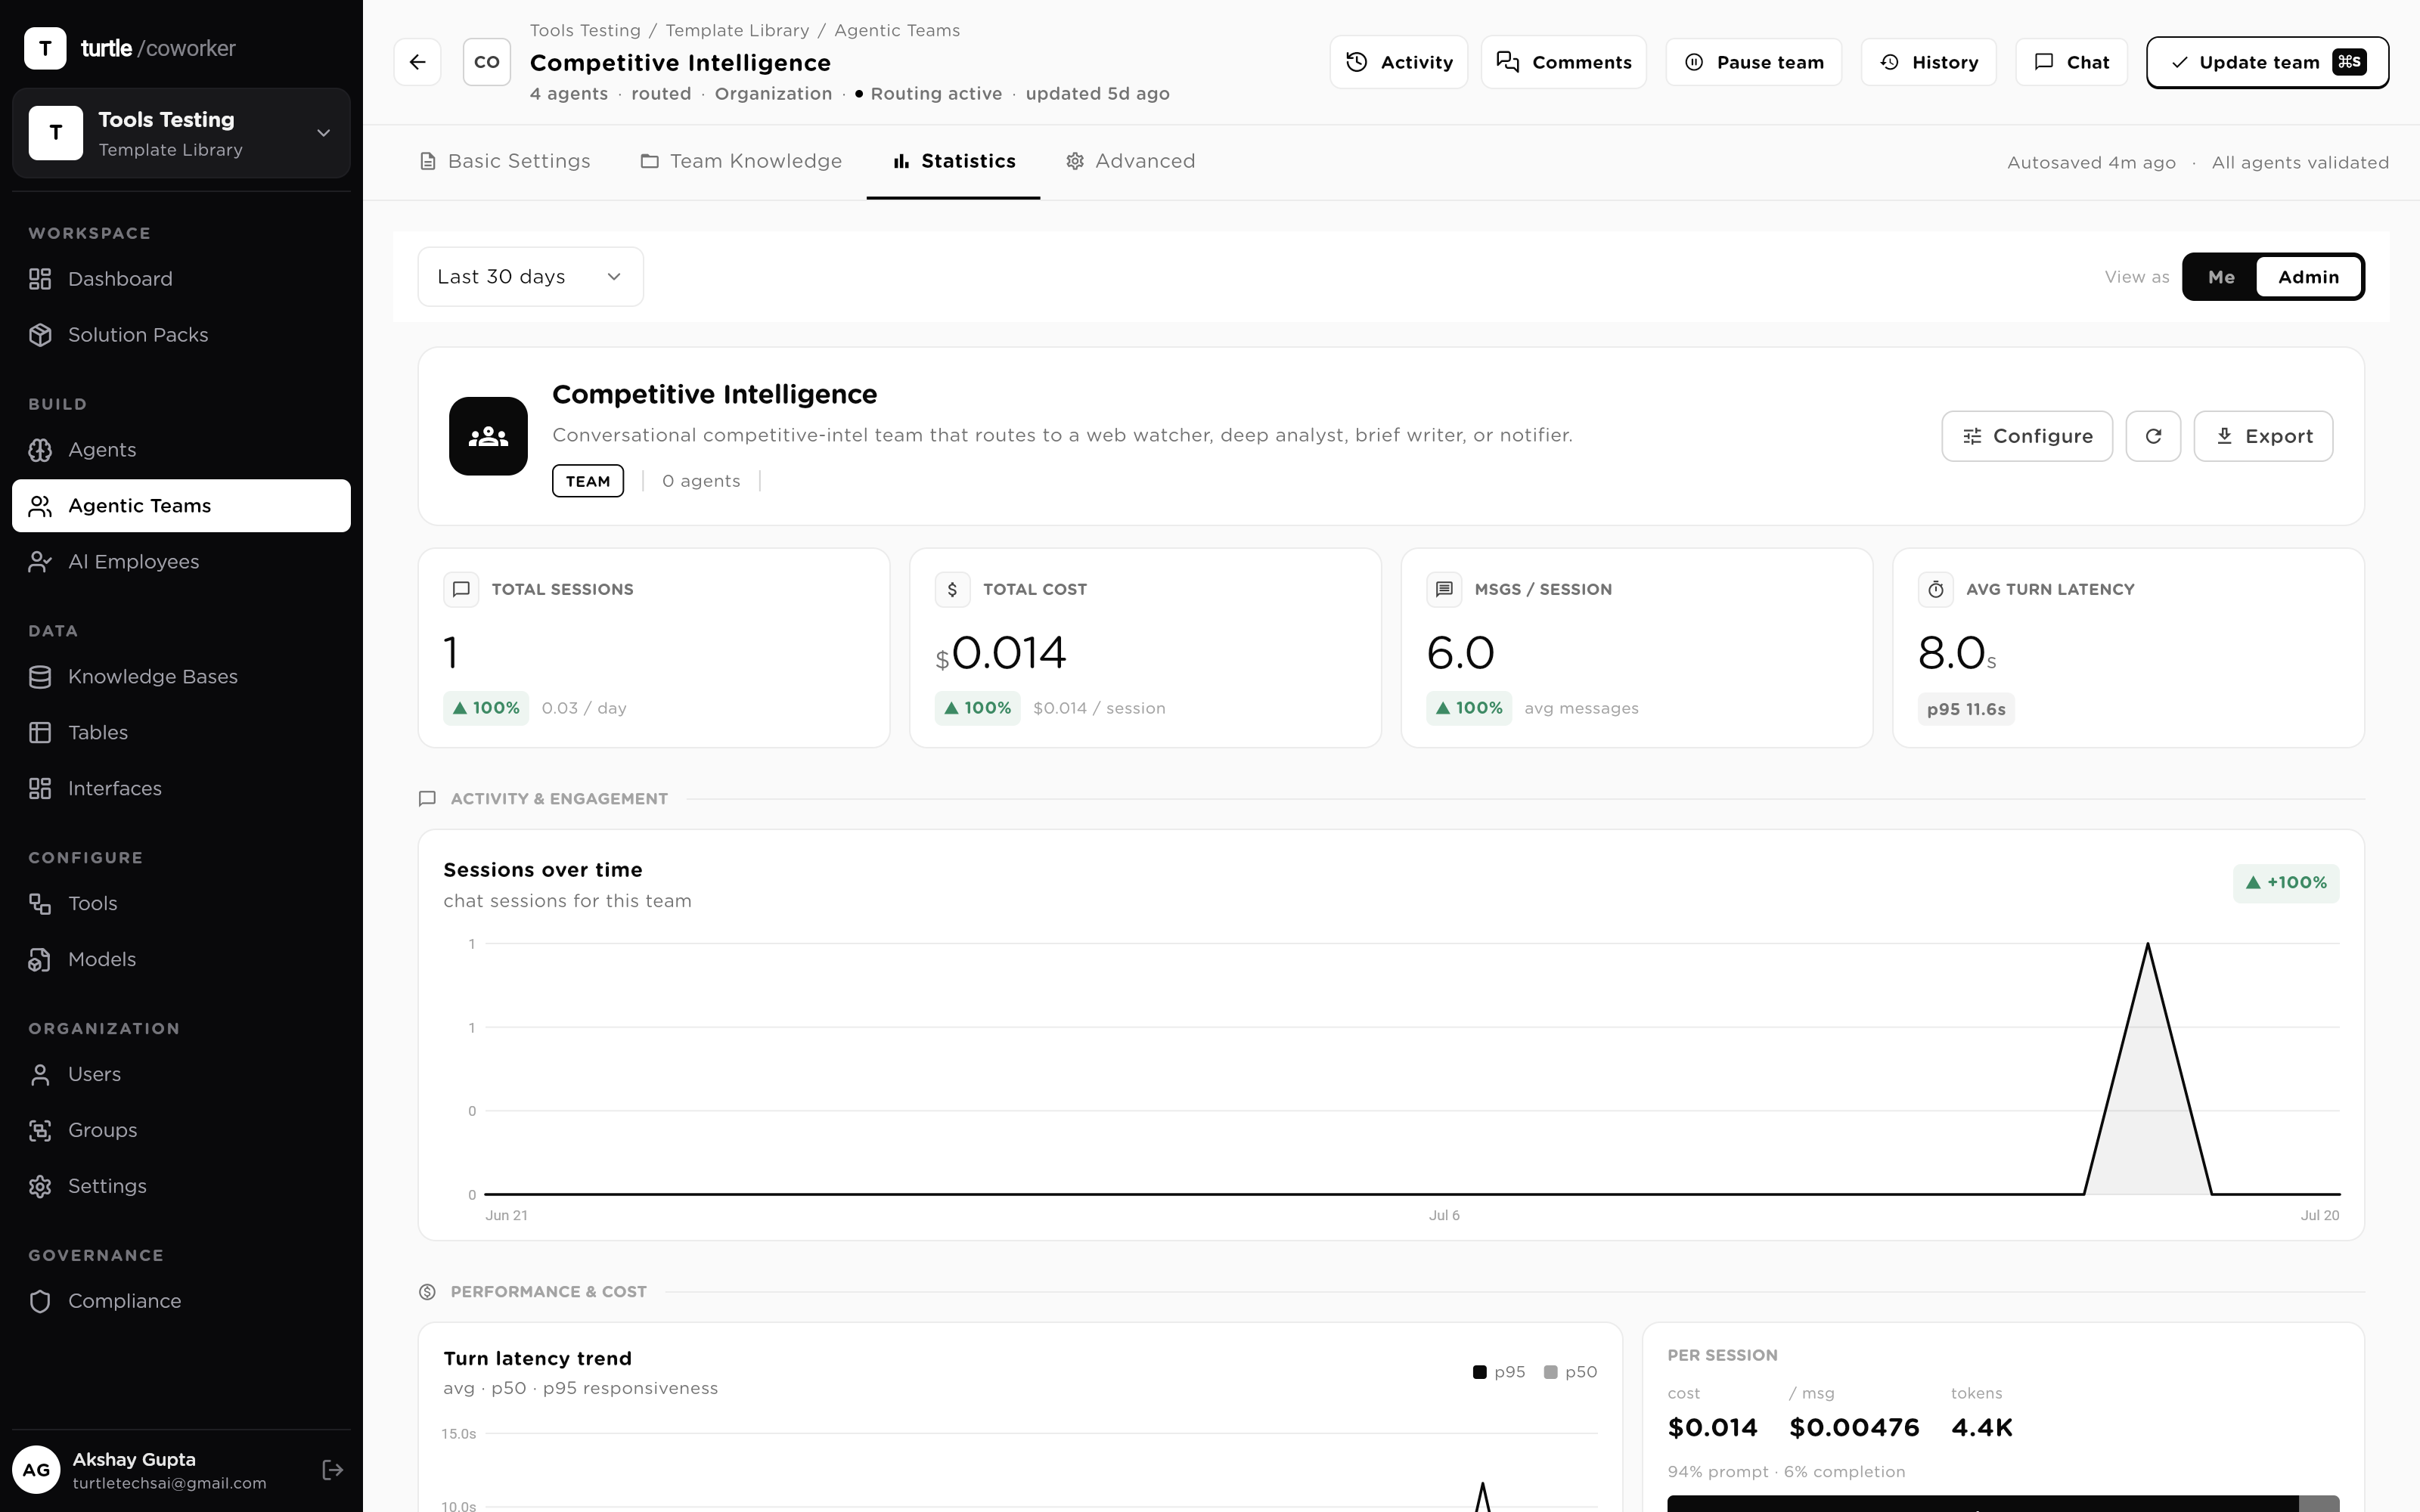
The Teams screen shows how each team actually performs — runs, cost and reliability per team, with member-level attribution. The AI Employees screen tracks whether a named employee is earning autonomy: a task funnel, a human-intervention rate that should be falling, and a memory panel that should be growing. A performance review becomes a chart, not an argument.
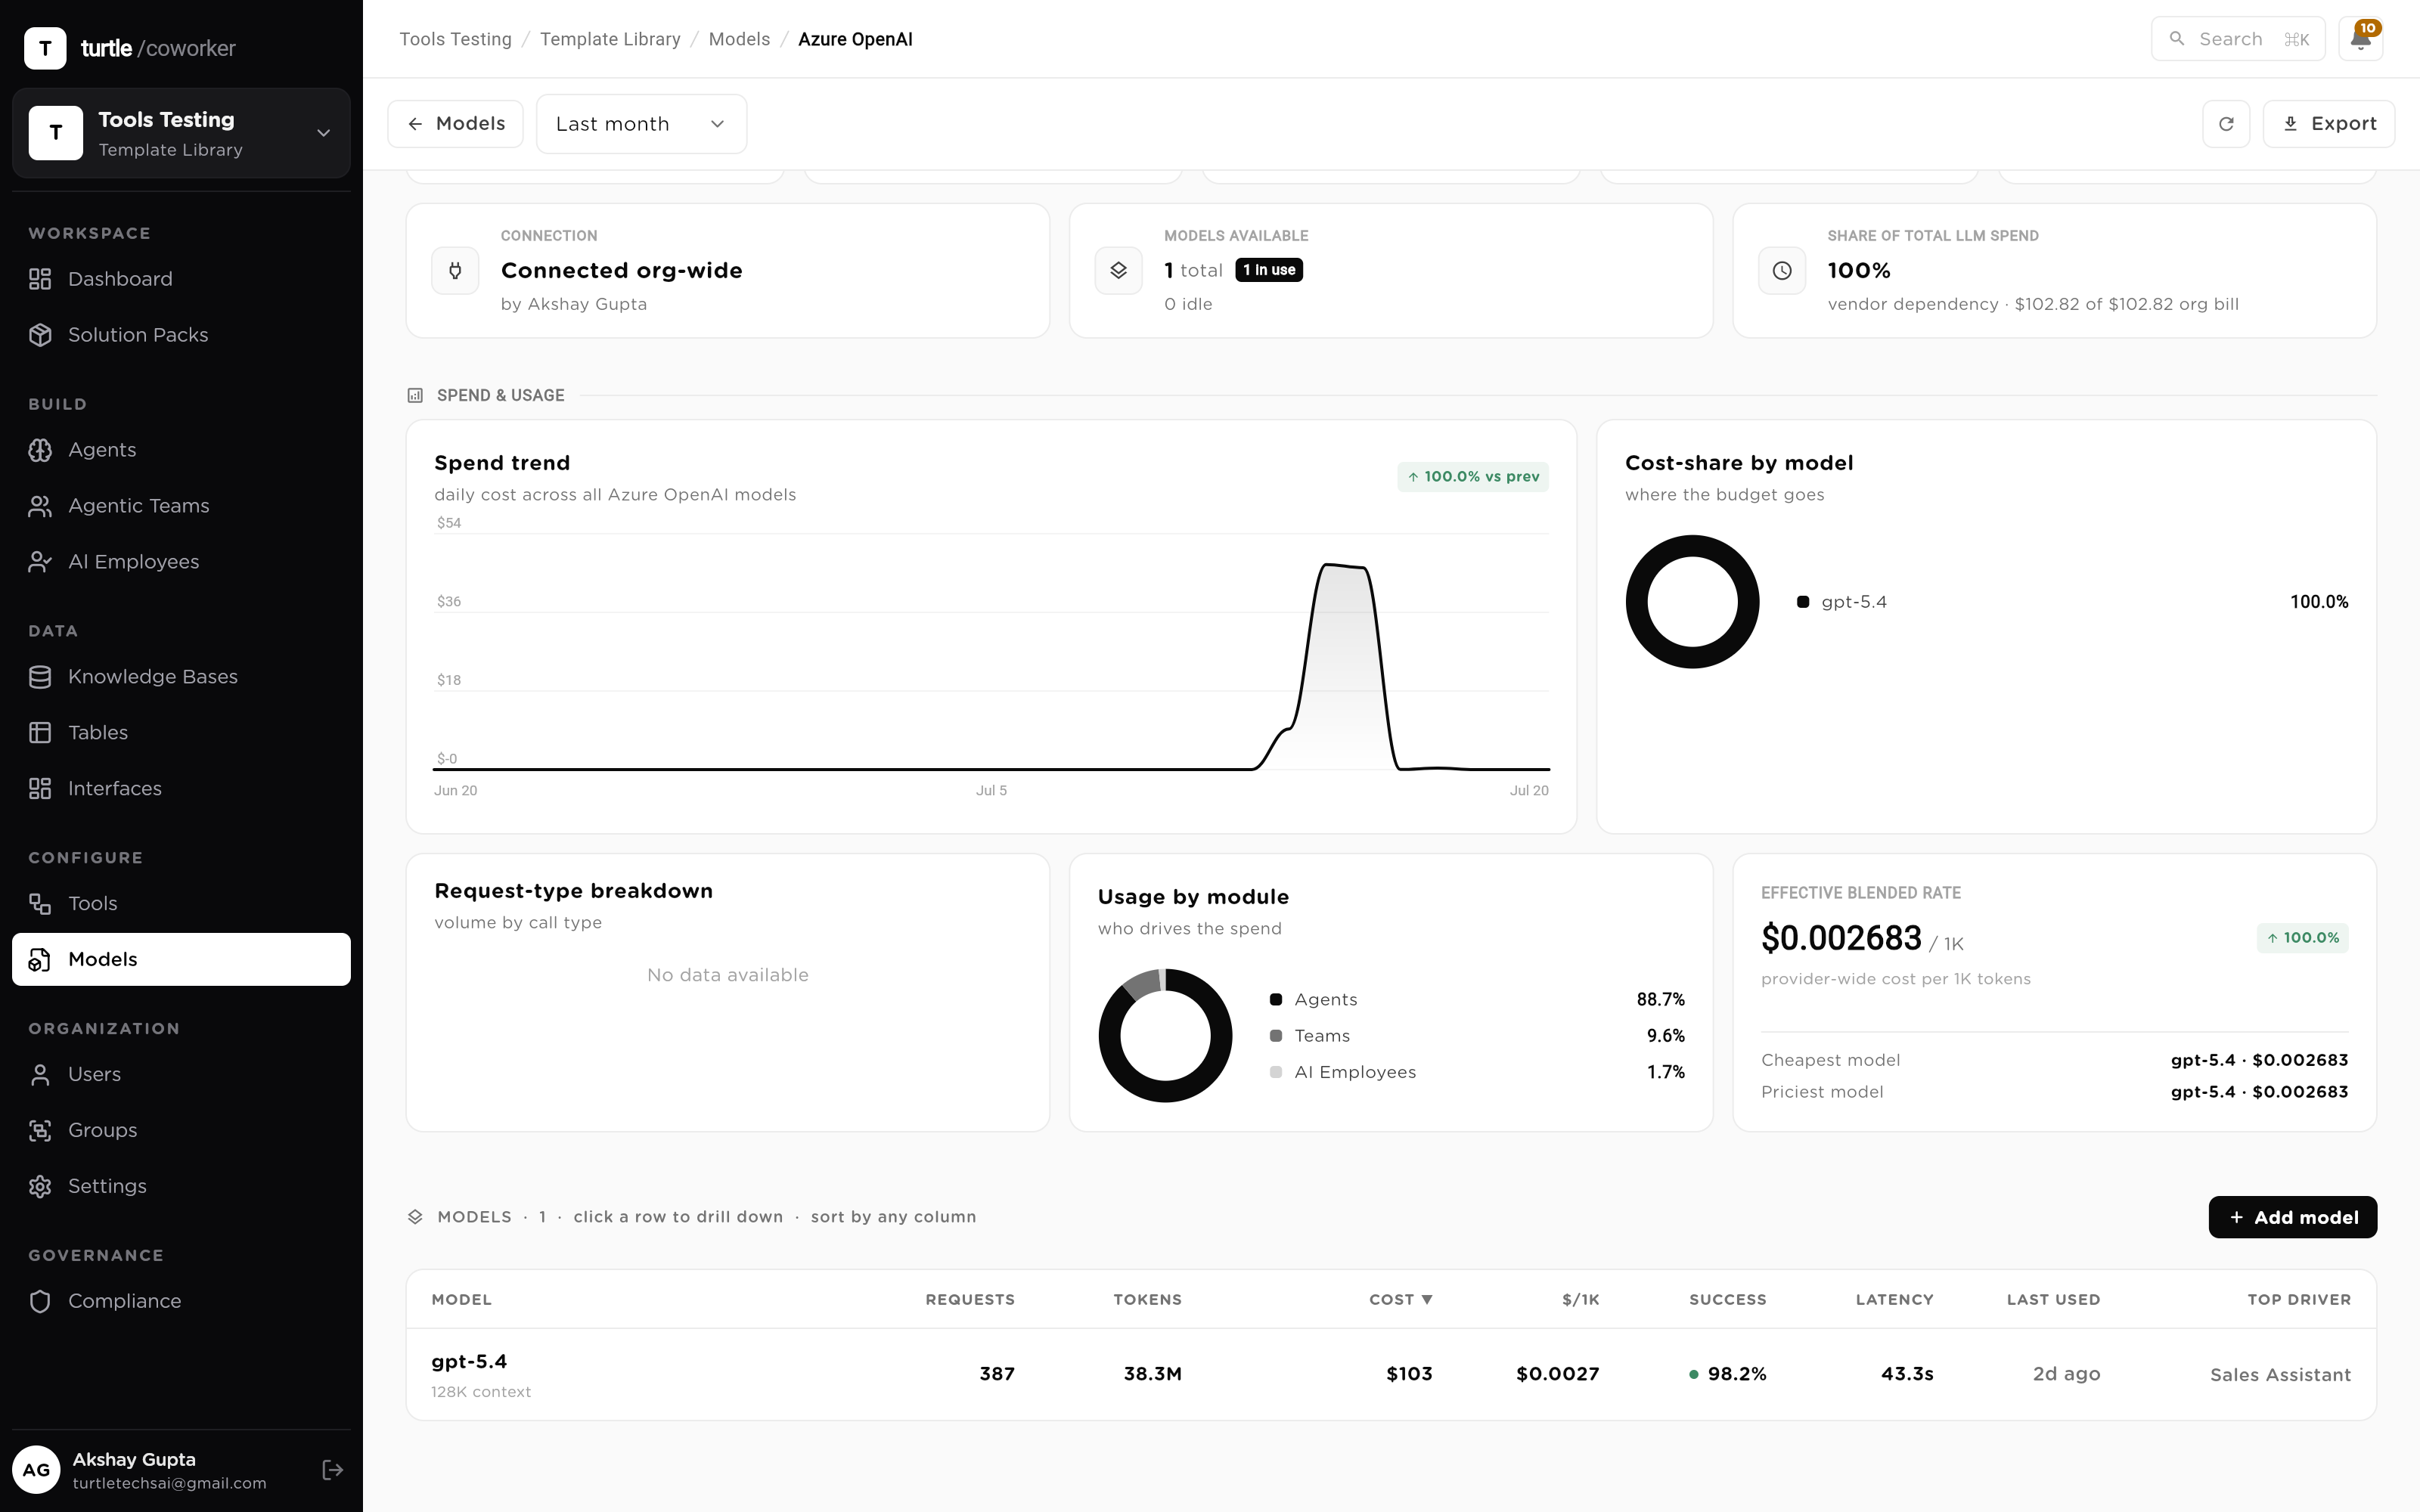
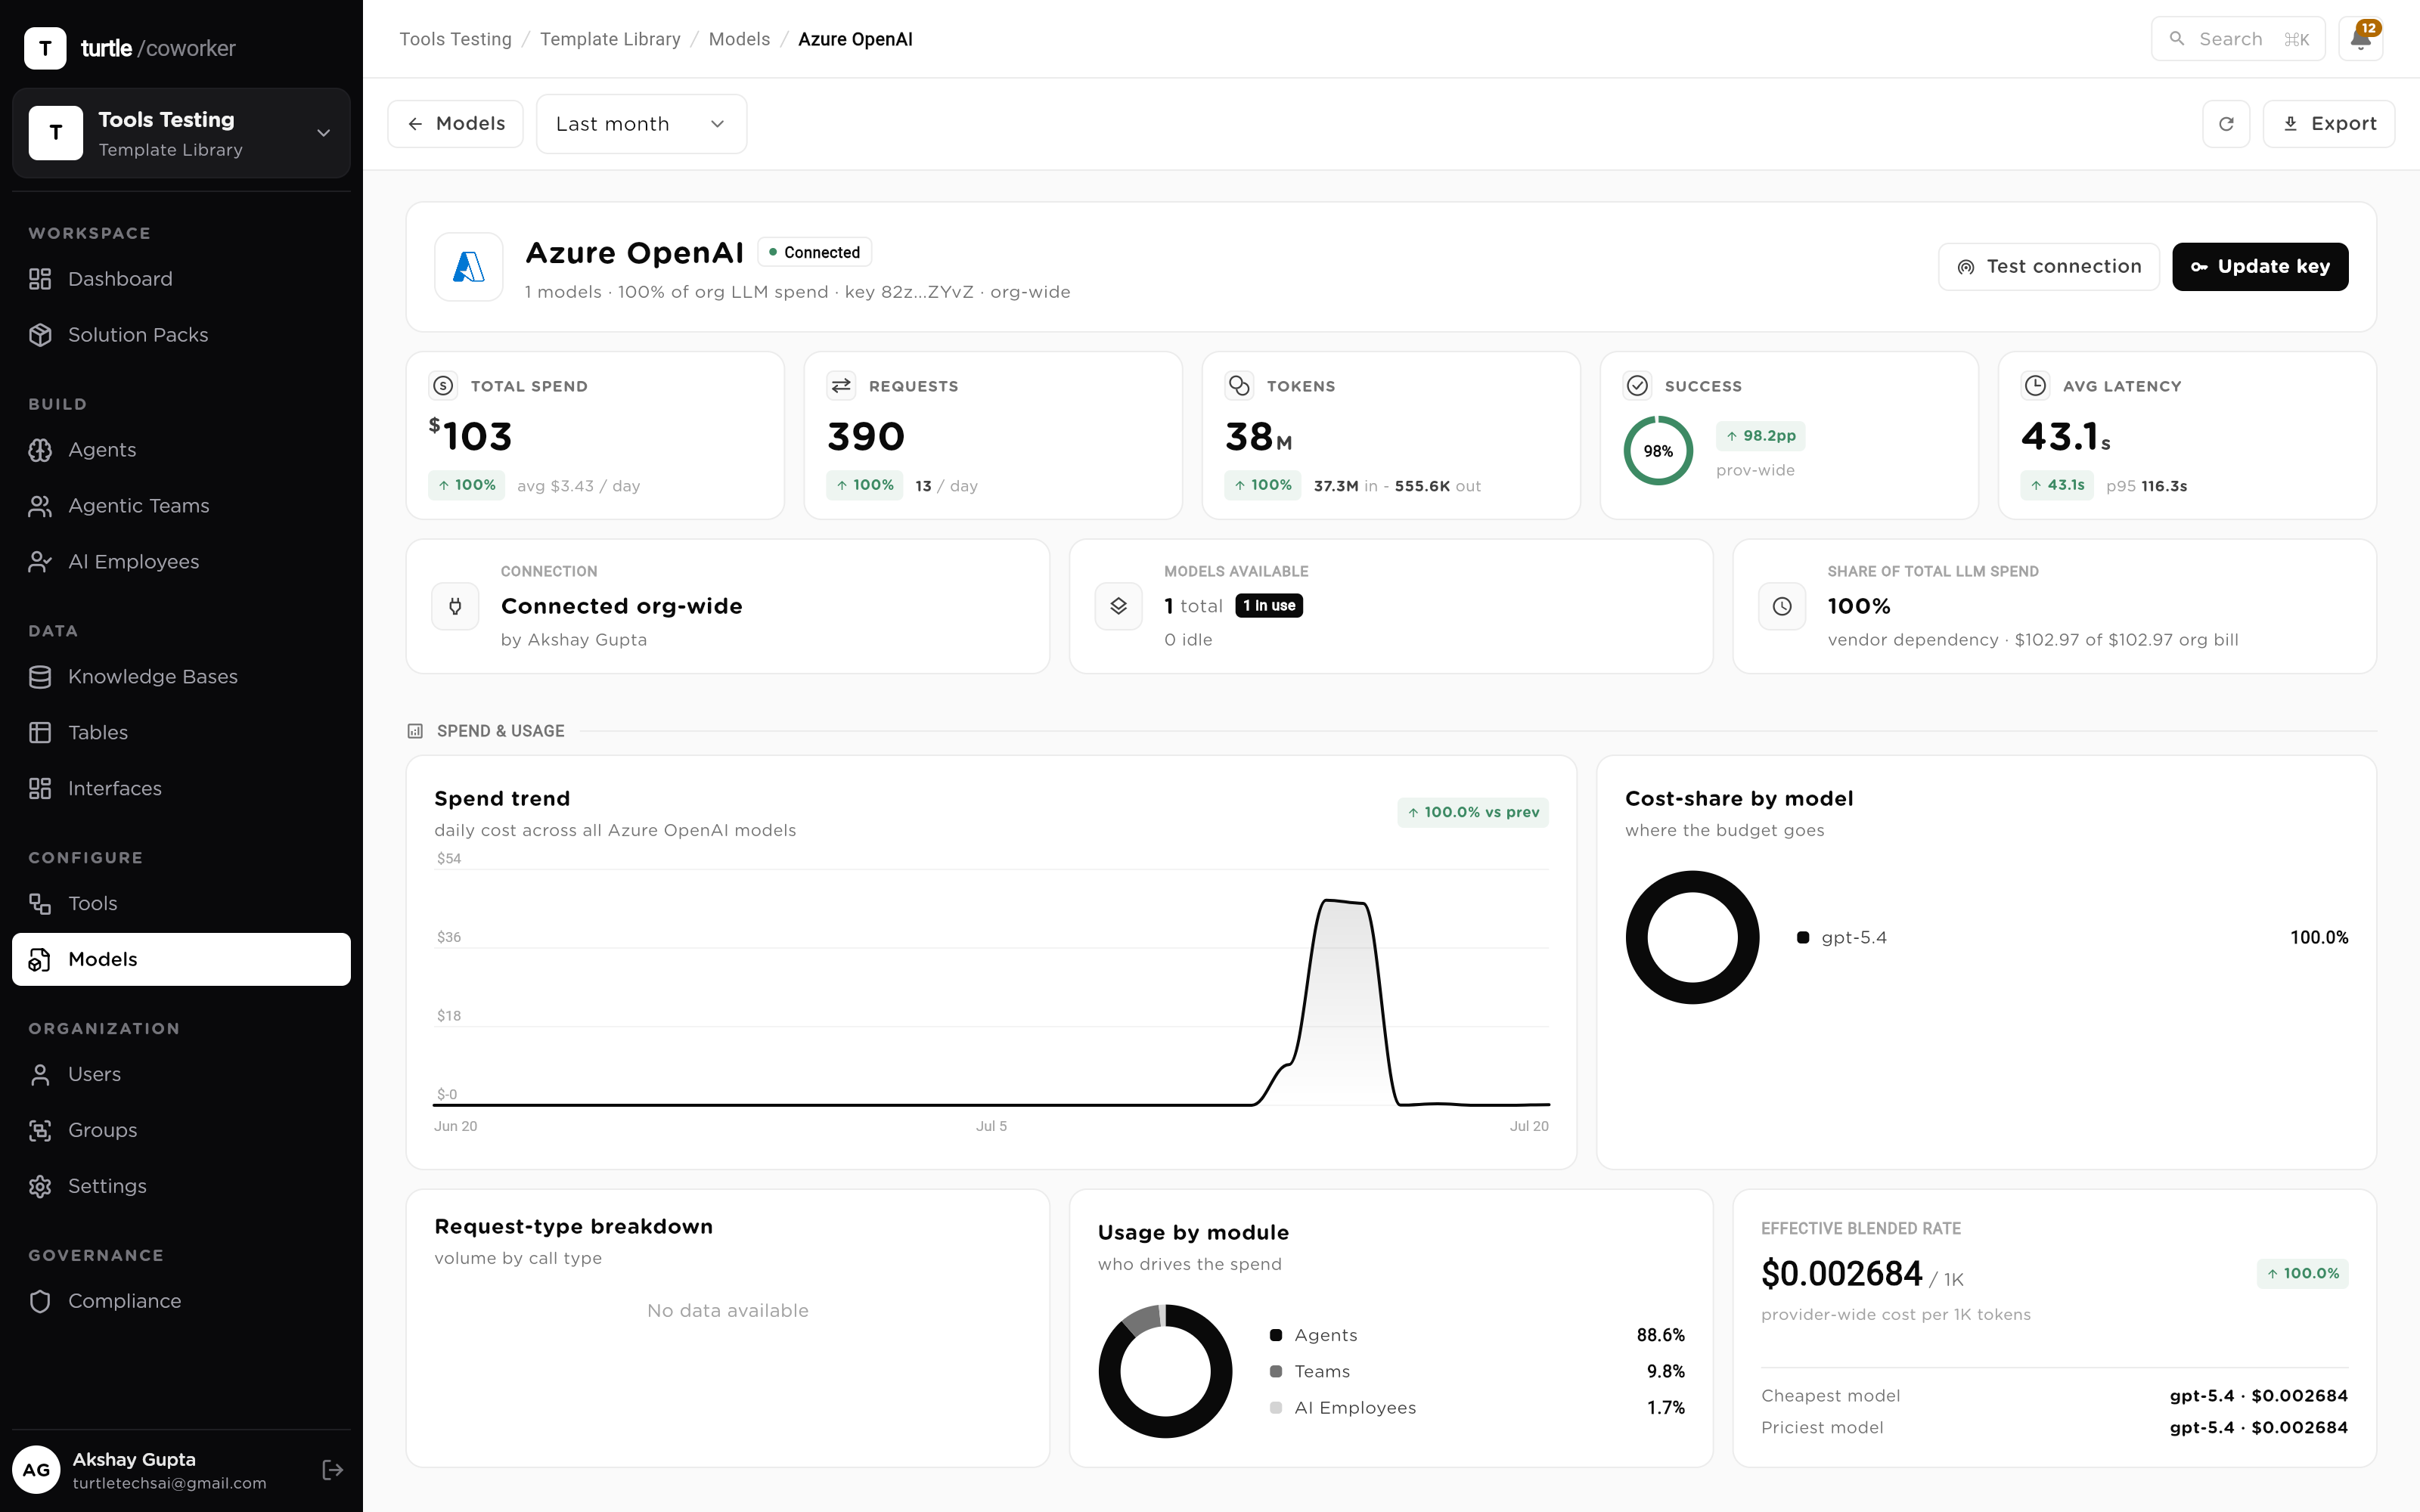
Model choice is a recurring cost decision most teams make once and never revisit. The Models screen weighs every LLM you run by cost, latency and success rate, side by side, measured from your own traffic — not from a vendor benchmark. When a cheaper model would hold the line on an extraction step, the numbers say so, and the swap is a per-agent setting, not a rebuild.
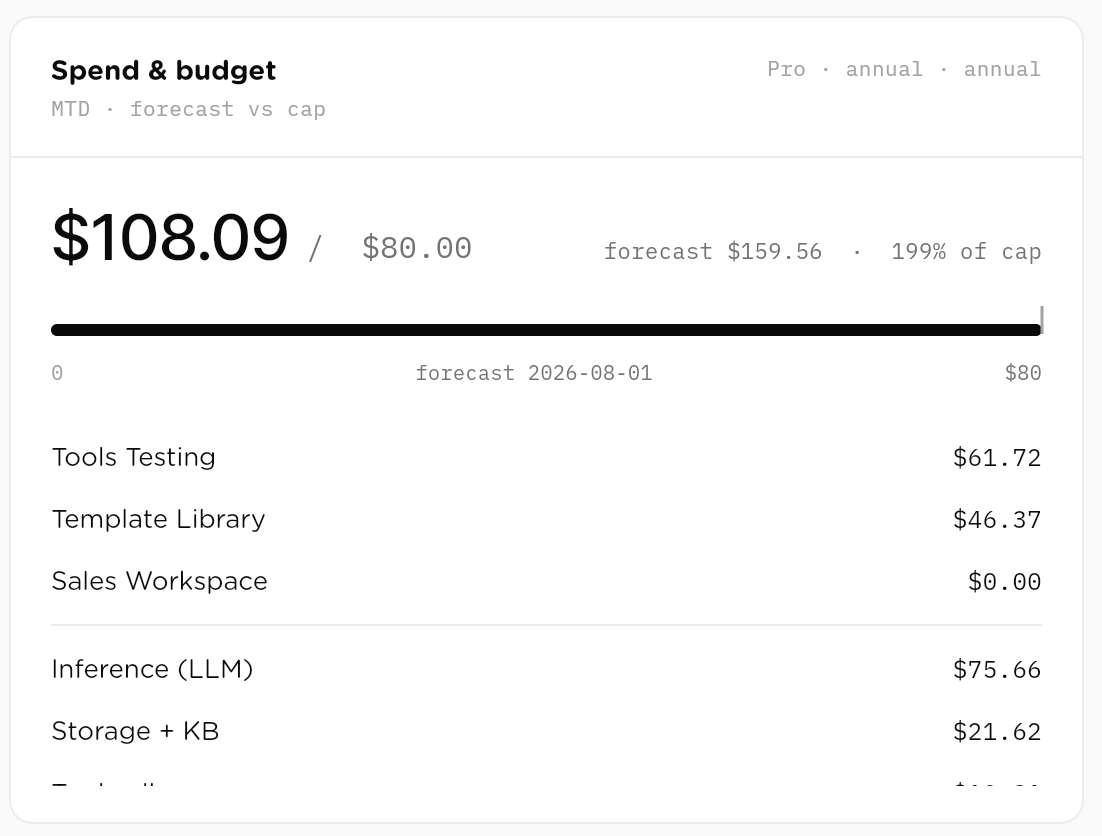
Numbers that stay in a dashboard don't survive a budget meeting. Spend here reads against the hard caps set in Governance — per workspace, employee or team, with a period-end forecast and the projected breach date in view. And any scoped view exports: a group's spend for chargeback, an agent's reliability for a post-mortem, a personal scorecard for a review. The date window, granularity and scope carry into the export.
A scenario: a support org runs a triage agent, two responder agents and an escalation employee against a 4-hour SLA. The quarter ends, finance and the ops lead sit down, and every number below is already in the ledger — nothing is reconstructed, surveyed or estimated.
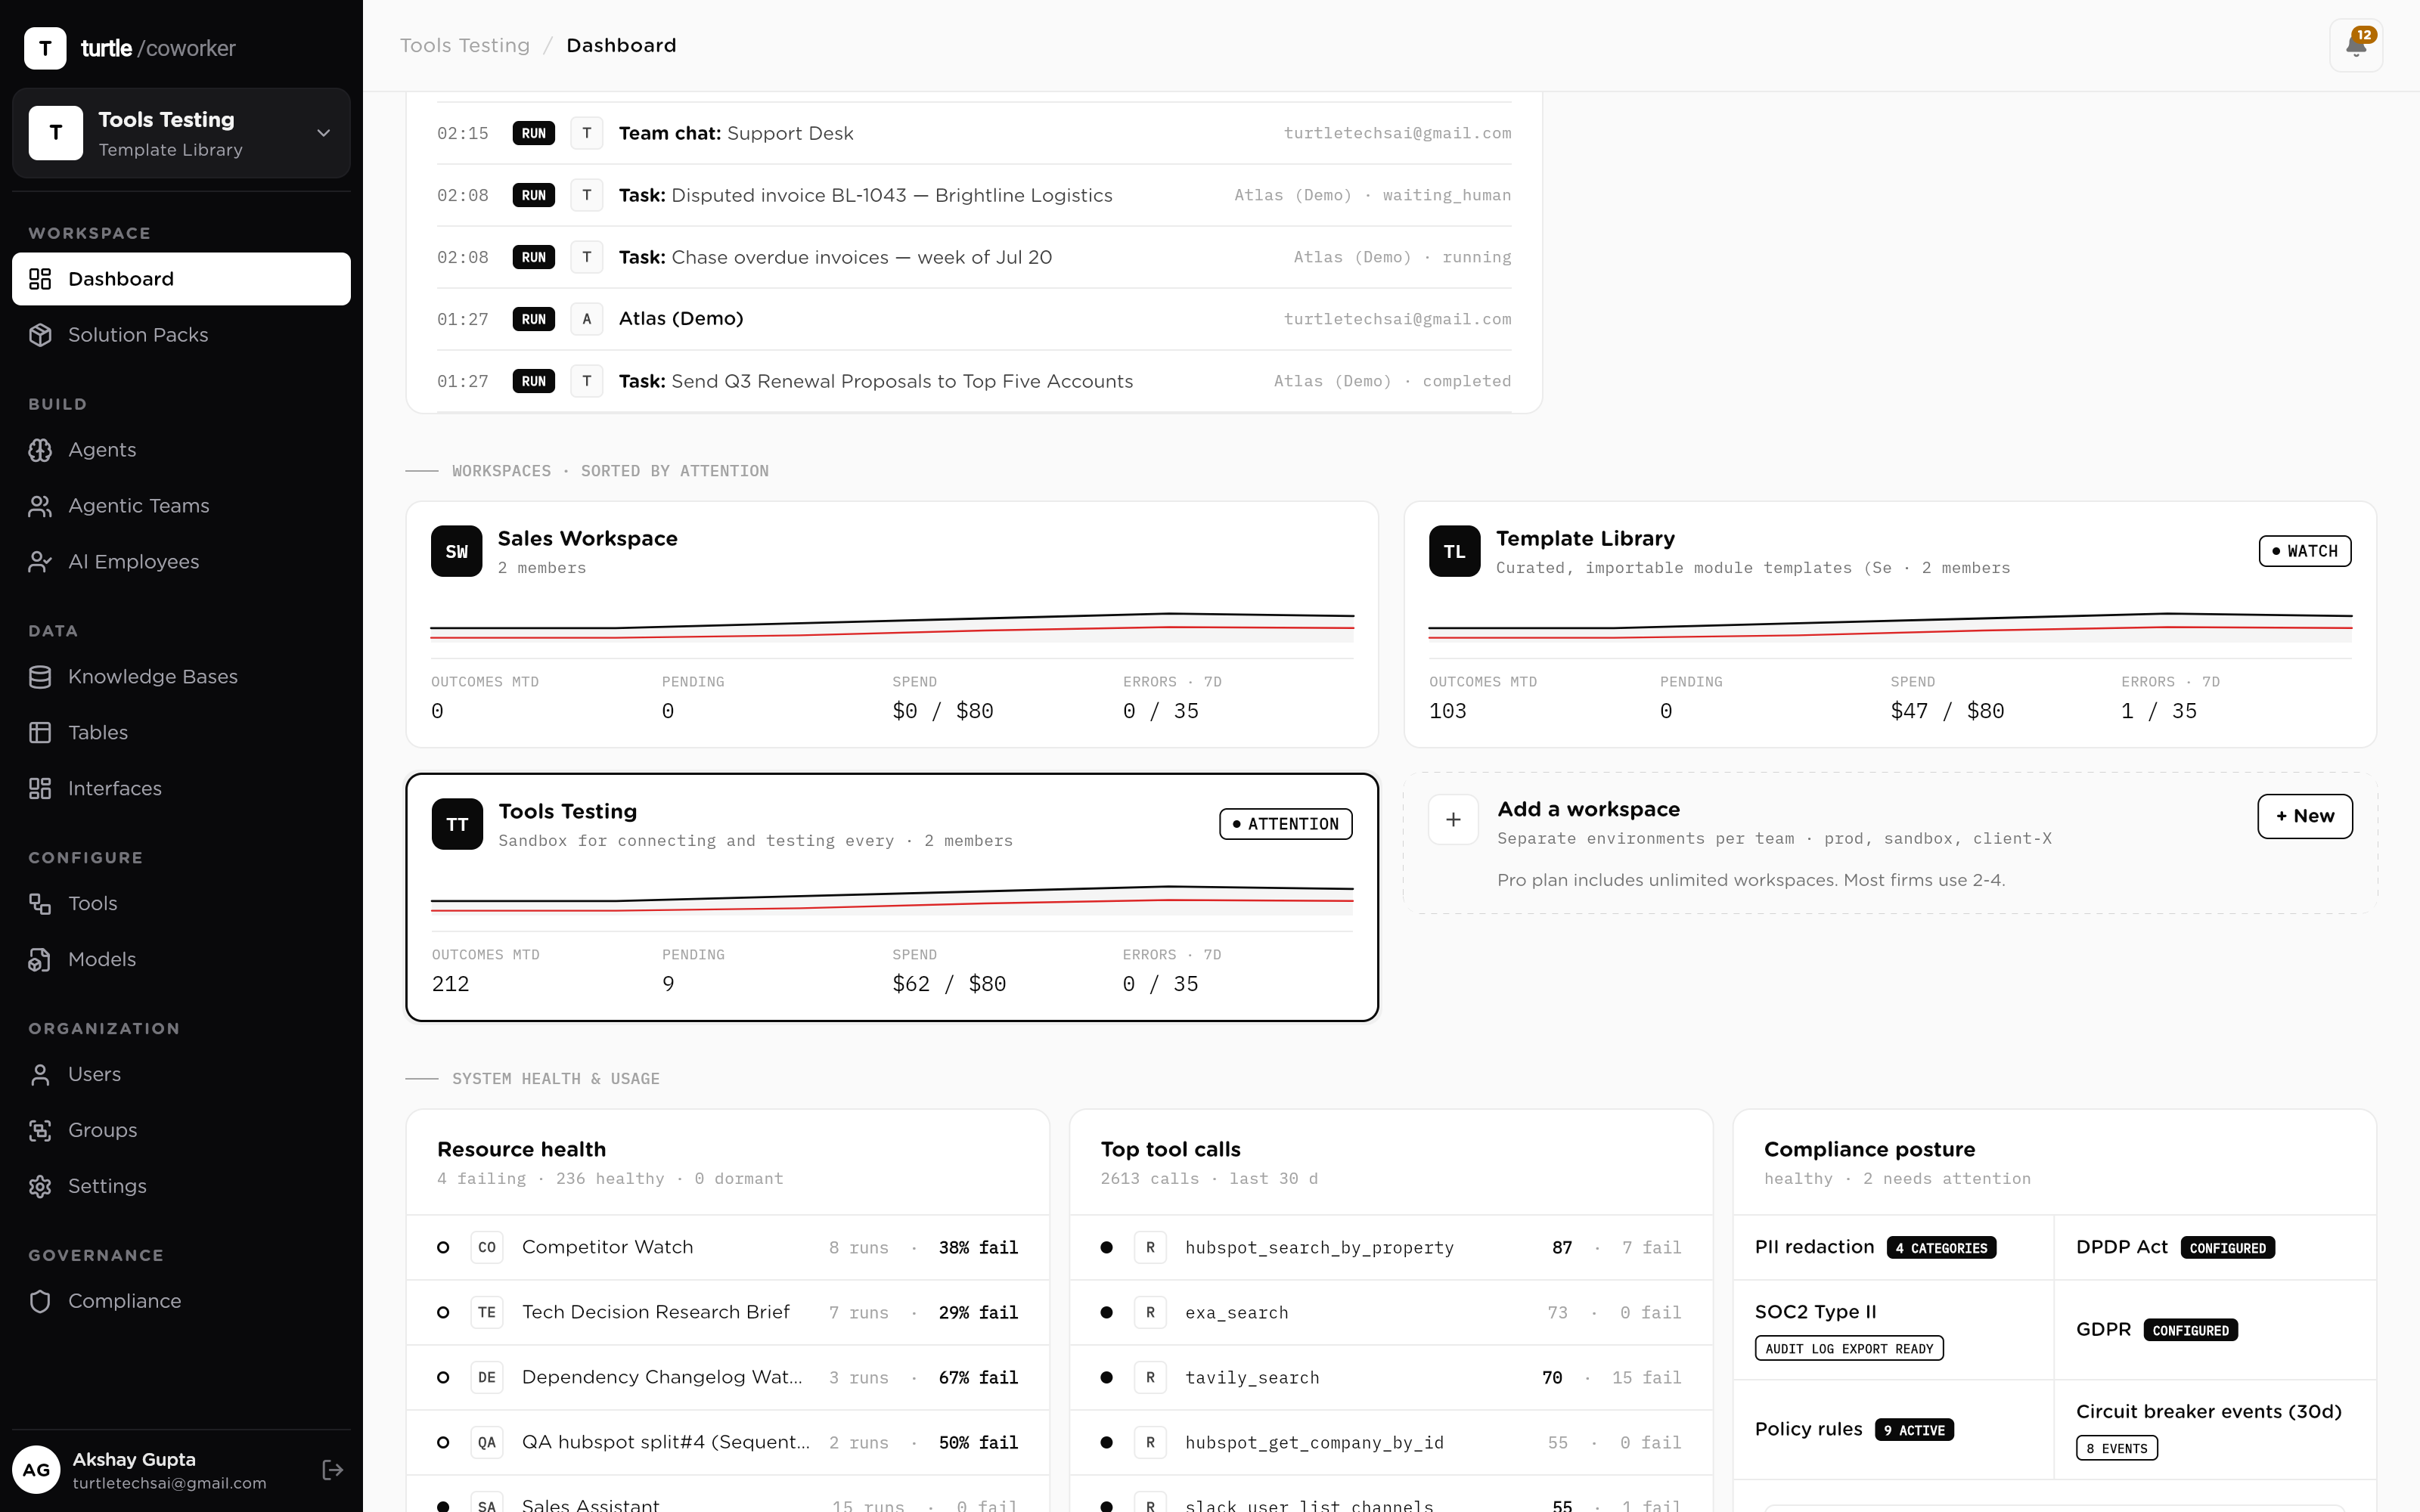
Per-message metering rolls up to cost per successful run, per session, per completed task — division, not estimation.
The cost trend stacked by module plus Top-by-spend name the worker driving this month's creep.
The highest-failure-rate leaderboard puts your worst worker at the top, ready to open and triage.
The Models table compares cost, latency and success per model from your own runs — evidence before you re-route traffic.
A falling intervention rate and a falling cost per completed task say the AI Employee is learning.
The Groups chargeback scorecard attributes org spend back to the team that drove it, and exports.
Complete operating system for a Chartered Accountant practice. Tracks clients, engagements, statutory deadlines, and IT/GST notices. Includes AI agents for notice triage, GST reconciliation, filing reminders, and client communication. Comes with an AI Employee (Priya) who coordinates compliance work end-to-end.
The accounts payable and bank reconciliation desk a fractional controller runs for a client. Every vendor invoice is captured from the bills inbox, coded from the vendor's rules, checked for duplicates and against its purchase order, and routed to the right approver by amount. Approved invoices become a posting pack for the ledger and a weekly payment run. Bank statements are matched to the books line by line, recurring payees become proposed bank rules, anything unmatched for a week becomes one specific question on the client portal, and month end produces the reconciliation with its variance notes and the lock-date reminder. Comes with Cass, an AP and Close Coordinator who runs the queue.
Signal-based outbound for a founder or a small GTM team. Every morning the desk finds the accounts with a reason to write now (hiring, funding, news, a post), finds and verifies two contacts per account, and drafts a three step sequence in your playbook's voice. You approve, and the email goes from your own inbox. Replies land in one queue, classified with the next step ready. Meetings get a one-page brief. Your CRM stays the record. Comes with Remy, an Outbound Coordinator who runs the morning queue.
Contracts drafted, sent, chased, filed and watched, with a person at every step that matters. A colleague requests a contract from the portal; the drafter fills the approved template from the request and the CRM and marks what it could not fill. A person reviews and sends it for signature. Every morning the unsigned envelopes are chased and the old ones escalated. When a contract is signed its key terms (payment, liability, termination, renewal, governing law) are read from the PDF into a table with anything non-standard flagged, and the signed copy is filed by counterparty and type under your naming convention. Every Monday the contracts inside their notice window get a renew, renegotiate or terminate note for the owner. Works with Dropbox Sign, Google Docs, Google Drive and HubSpot. No agent ever signs, voids or counter-signs. Comes with Ren, a Contracts Coordinator, a Contracts Helpdesk and a portal for requesters.
The support team's queue, prepared. Every new ticket is read, categorised, given a priority and a drafted reply from your help centre within a minute; a person reads and sends. Questions that keep coming back become draft articles. Bugs are escalated to engineering with the steps and the evidence attached. Calls are summarised into a ticket. At the end of the day the team gets the volume, the response time and the three complaints of the day. Works with your helpdesk (Zendesk, Freshdesk, Intercom, Help Scout, Gorgias, Front and others), your phone tool and your issue tracker. Nothing is sent, refunded or closed by the software. Comes with Sol, a Support Coordinator.
Founder-led content for a founder or a small team. Every morning the desk listens (Reddit, LinkedIn, X, YouTube) for what your buyers are asking, turns the best of it into ideas by pillar, and drafts posts in your voice for LinkedIn and X. You approve; the desk hands you the final text to paste and post. Comments and reactions on what you published are harvested, and the people who match your ICP become leads. A newsletter issue is assembled from the week. Monday tells you which pillar and format earned attention. Comes with Theo, a Content Producer.
We use analytics cookies to see which pages help and which don’t. Nothing loads until you choose. Cookie Policy

Hello there.
AI agent. It can make mistakes, and a human reviews anything that matters.